Las Vegas September 2017 Housing Stats –
First, please click on the link Las Vegas September 2017 Housing Stats for the full report so you have a visual to follow along with. I will be on the first page of the report.
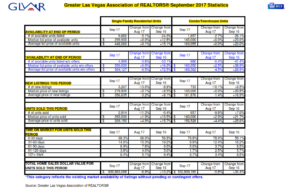
- The median price point for sold homes in September 2017 went up to $265,000. This is a 13.5% increase from September 2016. (The median sales price for a home in the Las Vegas Valley in 2016 was $233,000.)
- The number of homes sold in September 2017 was 2,914, which is a decrease of 0.4% from last September.
- # of available homes listed in September 2017 was 9,682. This number is DOWN 24.3% from September 2016.
- The number of new listings that came on the market in September 2017 was 3,267, down by 8.9% from last September.
- # of available homes listed in September without offers was 4,969, DOWN by 33.1% from last September, down slightly from last month.
- Time on market for homes sold: 0-30 days was 68.3%, last year at this time it was 56.9%. This is huge as we saw an increase of over 11% from last year of homes being sold within the first 30 days of being on the market. Time on market for homes sold: 31-121+ days are provided on the spreadsheet.
The long and short for the Las Vegas Market this month is that the market has not changed much from the last several months. We have a tight supply of listings, more homes have sold, and time on the market has become a little shorter. Currently, we have about a 3 month supply of homes on the market (maybe less from what some analysts think), when a normal market will have a 6 month supply. One of the important change from all this data is to notice that our median price point went up ($265,000) from last month and up 13.5% from last year at this time. This is still a very ripe time for sellers right now as prices are continuing to increase. We haven’t had the large price increases month over month that we saw in past years, but a healthy increase over the months for our marketplace.
The number of available listings on the market is down 33.1% from last year at this time. And the number of sold units is down a little by 0.4% from last year at this time. These two statistics combined are still putting pressure on our pricing to go up, which it has by 13.5% compared to last year at this time. The Median price point is $265,000. Sellers are continuing to “piggyback” on the recent sales. Please take this with a grain of salt as I don’t mean sellers can get crazy with their pricing as that would be unrealistic, but we are seeing a forward movement upwards.
The other numbers that we need to pay particularly close attention to, especially if you are a seller, are the number of available units listed without offers. The reason a seller needs to keep close tabs on the number of available units is this is going to be your competition once a seller lists their property. This is a general overview of the entire Las Vegas Market; however, I normally see the trends pretty much stay the same when we get into a specific part of town or subdivision. For September 2017, there was a decrease by 33.1% from September 2016 to 4,969 homes that were available without offers. This leads us to the number of homes sold in September 2017, which was 2,914, down by 0.4% from September of last year. This number is down by 11.3% from August 2017, so this is something that we will need to keep an eye on. If this number continues to go down and the number of listings starts to go up, then we may see a slight change in the market. However, this may take a few months to really notice if it is a trend.
The other statistic to pay attention to is “time on the market”. The change that we saw in September 2017 was that properties that sold within the first 30 days were at 68.3%, which is an increase of over 11% when compared to last year at this time.
In recent years, GLVAR (Greater Las Vegas Association of Realtors) has been reporting fewer distressed sales and more traditional home sales, where lenders are not controlling the transaction. That trend continued in September when 2.9% of all local sales were short sales, which was 4.6% last year at this time. Another 2.3% of all September sales were bank-owned, down from 6.0% from one year ago.
GLVAR said 25.7% of all local properties sold in September were purchased with cash, which is the same as last year at this time. That’s well short of the February 2013 peak of 59.5%, indicating that cash buyers and investors are still more active in Southern Nevada than in most markets, but that their influence has generally been declining.
We have a tight supply of listing on the market; more homes are being sold, causing another increase in pricing. In addition to the potential excitement of the Las Vegas Raiders coming to Las Vegas. If you are thinking of selling, this is a fantastic time to do so!!
If you would like more explanation with this report or specific data within the area you live in, please reach out to me at 702-427-9444 and I would be glad to answer any questions that you may have.
(Click here for complete 8 Page September 2017 Las Vegas Stats Report)
Visit www.LasVegasHomeValues.vegas to get a general idea of what your home value is.