Las Vegas January 2017 Stats –
First, please click on the Las Vegas January 2017 Stats link for the full report so you have a visual to follow along with as I will be on the first page of the report.
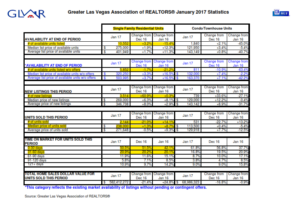
- The median price point for sold homes in January 2017 was $238,000. This is an 8.7% increase from January 2016.
- The overall median sales price for a home in the Las Vegas Valley in 2016 was $233,000.
- # of available units that were listed in January 2017 was 10,552. For January 2016 this number was 12,473.
- # of available homes that were listed without offers was 5,852. Last year at this time it was 7,428.
- The number of new listings that came on the market in January 2017 was 3,514.
- The average number of listing per month in Las Vegas for 2016 was 3,531 when you factor all the months together. Of course this is up from the holiday months of Nov & Dec in which months we normally see a decline.
- Time on market for homes sold: 0-30 days was 50.5%, last year at this time it was 42.1%. What is important to note on this is that we see an increase of 8% of homes being sold in the first 30 days from last year at this time.
- Time on market for homes sold: 31-121+ days are provided on the spreadsheet.
How do we decipher all these numbers and gain some clarity on what is going on with the Las Vegas market? One way is to look at the number of available listings on the market, which is down 21.2% from last year at this time. And then look at the number of sold units, which is up by 14.1% from last year at this time. A quick bottom line analysis, our listing inventory is down right now and our sold units are up, this is putting pressure on our pricing to go up. While at the same time, sellers are continuing to “piggy back” on the last sold comparables.
The other number that we need to pay particular close attention to, especially if you are a seller, are the number of available units listed without offers. The reason a seller needs to keep close tabs on the number of available units is because that is going to be your competition once a seller lists their property. This is a general overview of the entire Las Vegas Market, however, I normally see the trends pretty much stay the same when we get into a specific part of town or subdivision. For January 2017, there was a decrease by -1.7% from December to 5,852 units that were available without offers. This leads into the number of homes sold in January, which was 2,144, down by -21% from December, when there were 2,715 homes sold. This doesn’t surprise me that much as January’s closing are normally a little lower because we don’t see the activity with buyers as much in December because of the Holiday. This makes sense when you look at how long a “normal” escrow takes, which is usually in the ballpark of 30 days, give or take, depending on the exact situation.
The other statistic to pay attention to is the “time on the market”. The big change that we saw in January 2017 was when we compare the data to a year ago at this time. We saw that properties that sold within the first 30 days were up by 8% when compared to last year at this time.
So what’s the long and short of it all for this month? We have less listing on the market, more homes are being sold, causing another slight increase in pricing. If you are thinking of selling, this is a fantastic time to do so!!
If you would like more explanation with the Las Vegas January 2017 Stats or specific data within the area you live in, please reach out to me at 702-427-9444 and I would be glad to answer any questions that you may have.
 (Click For Complete 8pg Las Vegas January 2017 Stats report)